
The Fieldwork Question and Geographic Context
This criterion assesses the focus and geographic context of the fieldwork and to what extent the link between the fieldwork question and the geographic context (that is, material in the syllabus, a relevant syllabus topic or geographical theory) is made clear. The fieldwork question should be specifically geographical.
Top Level Descriptor
The link between the fieldwork question and the relevant syllabus topic, the syllabus or geographical theory is described. The link made to geographical theory allows for the possible formulation of hypotheses and predictions.
The fieldwork question is geographical and focused, clearly identifying a precise location allowing for primary data collection within the limits of the internal assessment.
One or more locational maps are presented and follow mapping conventions, providing clear information and details of the fieldwork location.
Suggested Word Count - 300
Syllabus Topic: Freshwater - River discharge and its relationship to stream flow, channel characteristics and hydraulic radius. You must explicitly write this syllabus link in your introduction.
Links to Geographical Theory: Bradshaw Model. Include the model in diagram form, and add annotations to explain all the variables that are relevant to the hypotheses you have formulated.
The Fieldwork Question: Think about what it is that you want to find out about. Your question should not lead to a yes/no answer eg "Does X affect Y?". Instead, try a "To what extent..." question. Your teacher will be able to give you some suggestions.
Formulating Hypotheses: What information do you need to address your research question? Think about the components of geographical theory and factors that you would need to know to answer your question. Your hypotheses should relate to these factors. Make sure you justify your hypotheses - what is your prediction based on?
Key terminology to help write your title and hypotheses:
Discharge, Elevation, Gradient, Distance downstream, Cross-sectional area, Velocity, Friction, Thalweg, Wetted perimeter, Hydraulic radius, Efficiency, Bradshaw Model, Channel bed roughness, erosion, transportation, deposition, sediment, competence, capacity.
A focused and precisely-located research question:
The study is specific to one river - Worblen River (tributary of the Aare River), Bern Canton, Switzerland.
Locational mapping (and the established conventions):
You should include one regional scale map, to locate Bern Canton and the course of the river within Switzerland. The second map should be local scale, and clearly identify the sites of data collection. No smaller than 1/2 side.
Both maps should be complete with Border, Orientation, Legend, Title, Scale. At least one should be hand-drawn (see below) and both maps should be fit-for-purpose, without any irrelevant details.
Suggested Research Question
To what extent does the Worblen River in Bern Canton, Switzerland, exhibit the fluvial characteristics of the Bradshaw Model?
Types of Hypotheses
1. Along a transect - "X will increase with distance from Y".
2. Comparison - "X will be higher than Y".
3. Correlation - "X will be negatively correlated with Y".
4. Causation - "X will always increase Y".
Methods of Investigation
This criterion assesses the description, justification and appropriateness of the method or methods including sampling and surveying techniques, primary or secondary data collection as appropriate used to investigate the question formulated.
Top Level Descriptor
The method(s) used for information and data collection are described, explaining clearly and accurately how the combination of data collected is relevant to the theory, question formulated or the hypotheses for the internal assessment.
They may describe statistical tests if appropriate.
The method(s), data collection instruments/technologies and sampling/surveying techniques are used correctly, resulting in reliable and good quality primary data supporting a relevant quantitative and/or qualitative analysis.
Suggested Word Count - 300
Describing and Explaining Data Collection Techniques: You need to paint a vivid picture here of exactly how you went about collecting your various sets of data. Write your description in a way that would enable the reader to copy your steps precisely. This would also be a good opportunity to outline your sampling strategy. For each data collection technique, you need to explain why you chose that technique, and why you carried it out in exactly that way.
Data Collected is Relevant to the Theory, Hypotheses and Research Question: This may appear in your explanation of your method techniques. You should relate each data collection technique to a particular hypothesis. You should not include any methods if they are not directly related to your study. All data collection should actively play a part in your ability to answer the research question; if it doesn't, leave it out.
Statistical Tests: These will be used as part of your analysis, using proven statistical methods to identify relationships between sets of data beyond simple visual correlations. You may want to outline which statistical methods you intend to use, and how you will calculate the data accordingly (the formula you will use, and a description of what it tells the reader).
Sampling Techniques: You will be collecting data along a line transect. The entire length of your transect is 12.4km. The 12 data collection sites have increasing distance downstream, so the sampling strategy you will employ is line sampling. This link to the Field Studies Council and this one for the Royal Geographical Society will give you more information. The 12 data collection sites will also allow you to use Spearman's Rank as a statistical analysis technique. This site will help you run the calculations in Excel. A worked example can be found here. Use this graph to calculate and display the significance of your findings.
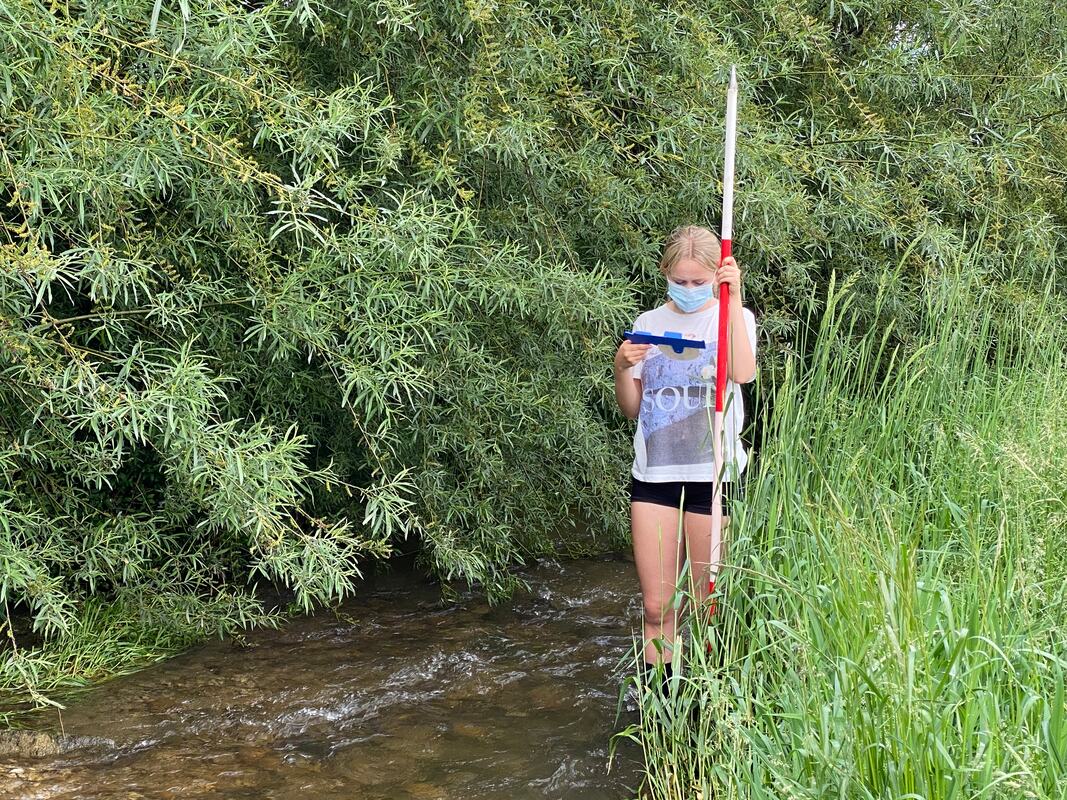
Correct Techniques: It is imperative that you perform your data collection properly. Preparation for your fieldwork should include making yourself familiar with the equipment you will use, and think carefully how to maintain accurate and reliable methods throughout your study. A clear method description will help to convey your accurate approach.
a successful approach is to include annotated photographs of each method being performed. This helps to describe the technique, and offers proof of reliable primary data collection.
Reliable and Good Quality Data: To ensure that your data is reliable, perform repeat tests and measurements. Be clinical to avoid any gaps in your data. Results should be recorded clearly and be stored somewhere safe.
Possible variables for this study
Channel width - measuring tape - metres and centimetres
Average channel depth - measuring tape and ranging pole - centimetres
Channel cross-sectional area - width x average depth - square metres
Wetted perimeter - weighted chain (or calculated using Pythagoras' theorem) - metres and centimetres
Hydraulic radius (channel efficiency) - cross-sectional area divided by wetted perimeter - no units of measurement
Velocity - flowmeter - metres per second
Channel gradient - clinometer - degrees
Bedload particle size - measuring tape or ruler - centimetres and millimetres
Data Collected is Relevant to the Theory, Hypotheses and Research Question: This may appear in your explanation of your method techniques. You should relate each data collection technique to a particular hypothesis. You should not include any methods if they are not directly related to your study. All data collection should actively play a part in your ability to answer the research question; if it doesn't, leave it out.
Statistical Tests: These will be used as part of your analysis, using proven statistical methods to identify relationships between sets of data beyond simple visual correlations. You may want to outline which statistical methods you intend to use, and how you will calculate the data accordingly (the formula you will use, and a description of what it tells the reader).
Sampling Techniques: You will be collecting data along a line transect. The entire length of your transect is 12.4km. The 12 data collection sites have increasing distance downstream, so the sampling strategy you will employ is line sampling. This link to the Field Studies Council and this one for the Royal Geographical Society will give you more information. The 12 data collection sites will also allow you to use Spearman's Rank as a statistical analysis technique. This site will help you run the calculations in Excel. A worked example can be found here. Use this graph to calculate and display the significance of your findings.
Correct Techniques: It is imperative that you perform your data collection properly. Preparation for your fieldwork should include making yourself familiar with the equipment you will use, and think carefully how to maintain accurate and reliable methods throughout your study. A clear method description will help to convey your accurate approach.
a successful approach is to include annotated photographs of each method being performed. This helps to describe the technique, and offers proof of reliable primary data collection.
Reliable and Good Quality Data: To ensure that your data is reliable, perform repeat tests and measurements. Be clinical to avoid any gaps in your data. Results should be recorded clearly and be stored somewhere safe.
Possible variables for this study
Channel width - measuring tape - metres and centimetres
Average channel depth - measuring tape and ranging pole - centimetres
Channel cross-sectional area - width x average depth - square metres
Wetted perimeter - weighted chain (or calculated using Pythagoras' theorem) - metres and centimetres
Hydraulic radius (channel efficiency) - cross-sectional area divided by wetted perimeter - no units of measurement
Velocity - flowmeter - metres per second
Channel gradient - clinometer - degrees
Bedload particle size - measuring tape or ruler - centimetres and millimetres

|
|

|
Quality and Treatment of Information Collected
This criterion assesses the quality of information and data collected and its suitability for analysis in criterion D, whether it is appropriate and a sufficient range of techniques have been used for the presentation of information, and whether the presentation follows accepted conventions (that is, the numbering, labelling, and annotating of tables, graphs and diagrams).
Top Level Descriptor:
The information and data collected is all directly relevant to the question formulated or the hypotheses, and is sufficient in quantity and quality to allow for analysis or answering of the question formulated.
The most appropriate techniques have been used effectively for the presentation of information and data collected.
The graphs, tables, diagrams or other illustrations follow conventions (labelling, titles, and so on).
Suggested Word Count - 500
Data Collected is Directly Relevant: As with the method, do not present any data that is not directly related to your hypotheses and research question. At the same time, you should not refer to any data that has not been presented in your IA.
Sufficient Quality and Quantity: Your data presentation needs to be of the highest quality. Be critical that your graphing is complete (axis labels, titles) but also clear enough to demonstrate the data and make it easier to interpret. If your graph just makes things more complicated, think again to be consistent in your quality. You should visualise all data and results that you refer to in your report; this will ensure you have sufficient quantity.
The Most Appropriate Techniques: Your report should not be a series of bar graphs; these look boring, and often are not the best way to convey your data findings to the reader. Think carefully about what it is that you are trying to get across, and employ a variety of complex presentation techniques. The use of GIS is highly recommended. Don't pick presentation techniques that are erroneous eg using line graphs for discontinuous data. Follow conventions like DRYMIX when plotting your variables on a graph. Do not underestimate the value of photographs in supporting your quantitative data and subsequent analysis, and demonstrating visible connections between the variables.
Presentation Conventions: Your data presentation should be integrated within your written analysis. It is highly inadvisable to place all your data presentation together in its own section of your IA. All graphing should be complete and ideally annotated to pick out the key points; do all the work for the reader. Consistent titles, figure numbers, axis labels, legend/key should be a minimum expectation.
| data_presentation_techniques.pptx |
Written Analysis
This criterion assesses the quality of the analysis of the results, referring to: • links to the question and hypotheses formulated • geographic context (that is, geographical theory, the syllabus, or the relevant syllabus topic) • information collected • statistics used (descriptive techniques—that is, graphs, charts, histograms and so on; as well as statistical techniques—that is, correlations, regression and so on) • illustrative material.
Top Level Descriptor:
The written analysis includes descriptive and statistical techniques (with confidence levels if appropriate) that are appropriate to the data and the question formulated.
The trends, patterns and statistics found, including outlyers and anomalies if present, are explained and linked to the question formulated, hypotheses, geographical theory, the fieldwork location and methods used.
The written analysis allows for answering the question formulated, with no or only minor gaps in the supporting evidence.
Suggested Word Count - 850
Descriptive and Statistical Techniques: Your analysis should refer to your primary data results and their inherent meanings, as well as information that can be drawn from the use of statistical means. You can find a blank graph here to present the significance of your Spearman's Rank result.
TRRAC Analysis: Your analysis should be consistent in approach by following the TRRAC technique. Trends/Patterns identified; Results specifically referred to; Reasons or explanations of your findings; Anomalies identified, described and explained; Connect or compare your results to other evidence you have; this will help to build towards addressing your hypotheses and answering your research question.
Analysis Allows the Question to be Answered: To allow you to fully answer your question, it is advisable to structure your analysis by hypothesis, rather than by each individual presentation technique. This will help to keep the focus on the specific hypothesis, and subsequently apply your findings to answer the title question.
Conclusion
This criterion assesses the ability of the student to summarize the findings of the fieldwork investigation.
Top Level Descriptor
There is a clear conclusion to the fieldwork question, which is supported by the analysis.
Suggested Word Count - 200
There is a clear conclusion to the fieldwork question, which is supported by the analysis.
Suggested Word Count - 200
A Clear Conclusion: This should be arranged over 4 paragraphs; one paragraph for each of the hypotheses where you state that it has been proven or disproven, then a final paragraph where you use your hypothesis outcomes to actually (yes, actually!) answer the research question. It is amazing how many students forget to answer the question!
Supported by the Analysis: For each paragraph in your conclusion, refer to the key data; that is the most significant fact or statistic that has led you to your answer or outcome. This will give your answer to the research question some factual reasoning.
Supported by the Analysis: For each paragraph in your conclusion, refer to the key data; that is the most significant fact or statistic that has led you to your answer or outcome. This will give your answer to the research question some factual reasoning.
Evaluation
This criterion assesses the student’s ability to review the investigative methodology.
Top Level Descriptor
The most appropriate and relevant strengths and/or weaknesses are explained regarding the data collection methods, the formulation of the fieldwork research question, the presentation of data/information and the choice of location. Suggestions for improvement are outlined and the potential impact of these improvements is explained.
Suggested Word Count - 300
Strengths and Weaknesses: You should evaluate the following by explaining: the quality of your data collection (strategies you chose to use, and the techniques you used to undertake them); the quality of your research question (your ability to fully and accurately answer it with no / minor omissions); the presentation of your data (choice of presentation and execution) and the choice of your location (overall and specific sites).
Suggestions for Improvement: Alongside your limitations you should suggest ways to resolve them. These suggestions should be clearly communicated, realistic in terms of possibility within the study, and you should explain why these potential improvements would benefit your overall investigation.
Suggestions for Improvement: Alongside your limitations you should suggest ways to resolve them. These suggestions should be clearly communicated, realistic in terms of possibility within the study, and you should explain why these potential improvements would benefit your overall investigation.